


Chad Peltier
Guest
How good will the 2016 Ohio State rushing attack be?
Chad Peltier via our friends at Land-Grant Holy Land
Visit their fantastic blog and read the full article (and so much more) here
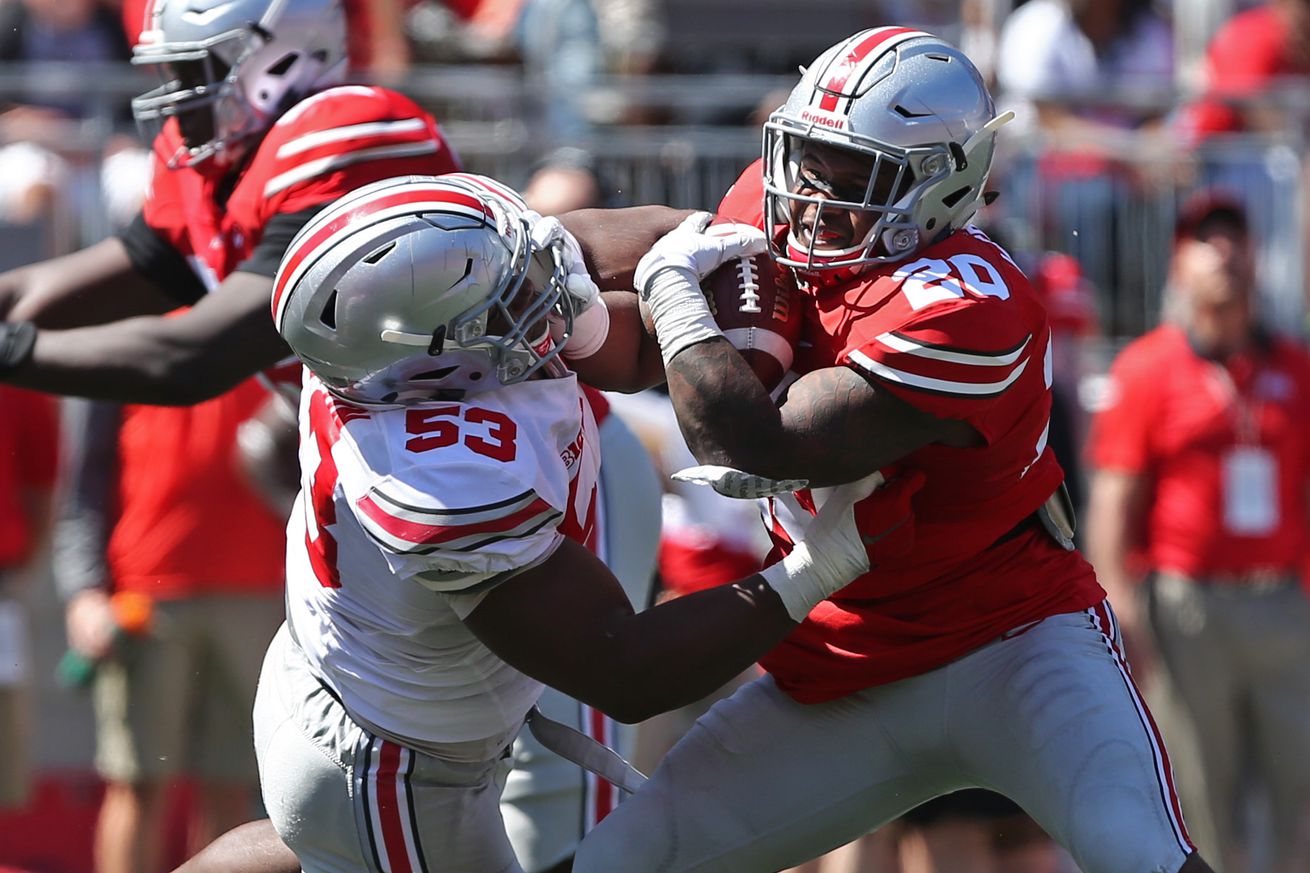
Ezekiel Elliott may be gone, but Buckeye fans should still have high expectations
Ezekiel Elliott may be gone. There's no clear starter at running back between Bri'onte Dunn and Mike Weber. The offensive line has to replace four starters, including both tackles. Only 15% of Ohio State's offensive experience will return for 2016.
In short, there's a lot of uncertainty for the 2016 Buckeye run game -- but there are also reasons to be optimistic. Below I'll look at four factors that should influence our benchmarks for a successful 2016 run game: precedent, J.T. Barrett, the offensive line, and recruiting talent.
From Zeke to Weber, but with Barrett as the constant
The Buckeyes are familiar with uncertainty in the run game. Ohio State had new names at both running back and quarterback in 2014. Ezekiel Elliott and J.T. Barrett were hardly known outside of the Buckeye community entering the season, but combined for 2,972 rushing yards en route to a national championship.
We're in a similar place for 2016. While Bri'onte Dunn could definitely win the running back race (or he and Weber could split carries), Mike Weber is the odds-on favorite. So what can Zeke and J.T.'s first year as starters tell us about next year?
In Zeke's sophomore year, he averaged 6.88 yards per carry and 6.64 highlight yards per opportunity, while maintaining a 46.5% opportunity rate. Opportunity rate is the percentage of carries that gain five yards or more -- which is theoretically the percentage of yards that the offensive line is responsible for (though, as a side note, Geoff Schwartz noted on the Solid Verbal that some running backs make their lines look much better).
Essentially, that means that Zeke was both dependable -- nearly half of his rushes gained at least five yards -- and explosive -- with nearly 6.64 average highlight yards (average yards after the initial five -- a measure of how big a player's big runs are). So even with a mostly-new line in 2014, Zeke was able to be both efficient and explosive, fueling the stretch run of the Buckeye's playoff push. He nearly repeated those numbers in 2015 despite a less-efficient passing game and quarterback uncertainty for much of the season.
So, assuming Mike Weber wins the job and doesn't share carries, it's fair to expect roughly a 6-6.25 yards per carry, 5.5-6 highlight yards per opportunity, and a 42-45% opportunity rate out of Weber.
Stability at quarterback with J.T. Barrett certainly will help. Not only will a healthy passing game benefit the run game, but so will a reliable second ground threat from the quarterback. J.T.'s rushing numbers declined by over a highlight yard per opportunity, though his opportunity rate only dropped by 2%. This indicates that J.T. was nearly as efficient with fewer touches last season, but he didn't generate as many explosive runs as he did in 2014.
But stability should benefit J.T. greatly for 2016, so it's fair to expect similar numbers at J.T.'s 2014 campaign: over 6.5 yards per carry, 6 highlight yards per opportunity, and a mid-50s opportunity rate.
Replacing The Slobs
The other half of the equation is the offensive line. Despite replacing four starters, there's reason to expect good things from this year's group. For one, the first stringers will all be incredibly talented, no matter who ends up in that first group. Second, the team replaced four starters for the 2014 season -- what's to say they can't repeat that successful transition for 2016?
The 2014 line, which only returned Taylor Decker, managed to lead the country in opportunity rate, meaning that they created the most efficient overall rushing attack, and were second in opponent-adjusted line yards. Their one deficiency was in power success rate, which measures short-yardage situations.
The 2015 line, which was much more experienced, was still top-ten in the first two categories, but improved in short-yardage situations and fell in allowing negative rushing plays. It remains to be seen whether the 2016 version will achieve the same level of excellence, but I wouldn't bet against Ed Warinner's group.
Looking at talent
Finally, I looked at the recruiting rankings for Zeke and Mike Weber according to the 247 Composite. As you can see, they're neck and neck, with Zeke holding a slight edge. So all in all, it's fair to have high expectations for the 2016 run game, despite the near-total turnover on offense.
Continue reading...
Chad Peltier via our friends at Land-Grant Holy Land
Visit their fantastic blog and read the full article (and so much more) here
Ezekiel Elliott may be gone, but Buckeye fans should still have high expectations
Ezekiel Elliott may be gone. There's no clear starter at running back between Bri'onte Dunn and Mike Weber. The offensive line has to replace four starters, including both tackles. Only 15% of Ohio State's offensive experience will return for 2016.
In short, there's a lot of uncertainty for the 2016 Buckeye run game -- but there are also reasons to be optimistic. Below I'll look at four factors that should influence our benchmarks for a successful 2016 run game: precedent, J.T. Barrett, the offensive line, and recruiting talent.
From Zeke to Weber, but with Barrett as the constant
The Buckeyes are familiar with uncertainty in the run game. Ohio State had new names at both running back and quarterback in 2014. Ezekiel Elliott and J.T. Barrett were hardly known outside of the Buckeye community entering the season, but combined for 2,972 rushing yards en route to a national championship.
We're in a similar place for 2016. While Bri'onte Dunn could definitely win the running back race (or he and Weber could split carries), Mike Weber is the odds-on favorite. So what can Zeke and J.T.'s first year as starters tell us about next year?
In Zeke's sophomore year, he averaged 6.88 yards per carry and 6.64 highlight yards per opportunity, while maintaining a 46.5% opportunity rate. Opportunity rate is the percentage of carries that gain five yards or more -- which is theoretically the percentage of yards that the offensive line is responsible for (though, as a side note, Geoff Schwartz noted on the Solid Verbal that some running backs make their lines look much better).
Year
Offense
Player
Position
Class
Rushes
Yards
YPC
Hlt Yds
Hlt Opps
Hlt Yds/Opp
Opp Rate
2014
2014
Ohio State
Elliott
RB
SO
273
1878
6.88
842.9
127
6.64
46.5%
2014
2014
Ohio State
Barrett
QB
FR
148
1094
7.39
504.6
82
6.15
55.4%
2015
2015
Ohio State
Elliott
RB
JR
289
1821
6.3
784.1
130
6.03
45.0%
2015
2015
Ohio State
Barrett
QB
SO
109
714
6.55
278.6
58
4.8
53.2%
Essentially, that means that Zeke was both dependable -- nearly half of his rushes gained at least five yards -- and explosive -- with nearly 6.64 average highlight yards (average yards after the initial five -- a measure of how big a player's big runs are). So even with a mostly-new line in 2014, Zeke was able to be both efficient and explosive, fueling the stretch run of the Buckeye's playoff push. He nearly repeated those numbers in 2015 despite a less-efficient passing game and quarterback uncertainty for much of the season.
So, assuming Mike Weber wins the job and doesn't share carries, it's fair to expect roughly a 6-6.25 yards per carry, 5.5-6 highlight yards per opportunity, and a 42-45% opportunity rate out of Weber.
Stability at quarterback with J.T. Barrett certainly will help. Not only will a healthy passing game benefit the run game, but so will a reliable second ground threat from the quarterback. J.T.'s rushing numbers declined by over a highlight yard per opportunity, though his opportunity rate only dropped by 2%. This indicates that J.T. was nearly as efficient with fewer touches last season, but he didn't generate as many explosive runs as he did in 2014.
But stability should benefit J.T. greatly for 2016, so it's fair to expect similar numbers at J.T.'s 2014 campaign: over 6.5 yards per carry, 6 highlight yards per opportunity, and a mid-50s opportunity rate.
Replacing The Slobs
The other half of the equation is the offensive line. Despite replacing four starters, there's reason to expect good things from this year's group. For one, the first stringers will all be incredibly talented, no matter who ends up in that first group. Second, the team replaced four starters for the 2014 season -- what's to say they can't repeat that successful transition for 2016?
Year
Offense
Adj. LY
Rk
Opp. Rate
Rk
Power Success Rate
Rk
Stuff Rate
Rk
2014
2014
Ohio State
133.7
2
49.50%
1
69.10%
48
14.70%
12
2015
2015
Ohio State
120.2
7
47.40%
2
77.20%
7
17.90%
42
The 2014 line, which only returned Taylor Decker, managed to lead the country in opportunity rate, meaning that they created the most efficient overall rushing attack, and were second in opponent-adjusted line yards. Their one deficiency was in power success rate, which measures short-yardage situations.
The 2015 line, which was much more experienced, was still top-ten in the first two categories, but improved in short-yardage situations and fell in allowing negative rushing plays. It remains to be seen whether the 2016 version will achieve the same level of excellence, but I wouldn't bet against Ed Warinner's group.
Looking at talent
Finally, I looked at the recruiting rankings for Zeke and Mike Weber according to the 247 Composite. As you can see, they're neck and neck, with Zeke holding a slight edge. So all in all, it's fair to have high expectations for the 2016 run game, despite the near-total turnover on offense.
Player
Class
247 Rating
Ezekiel Elliott
Ezekiel Elliott
2013
0.9693
Mike Weber
Mike Weber
2015
0.9603
Continue reading...