3yardsandacloud
Administrator Emeritus
College Football Home Attendance Hits All-Time High
Jan. 24, 2004
By Richard M. Campbell
NCAA Assistant Director of Statistics
Attendance Rankings by Division: I-A | I-AA | II | III
Rankings by Conference
It was no secret that many football fans were disappointed with the Bowl Championship Series (BCS) results, which produced Division I-A national co-champions, LSU and Southern California. In spite of the split national championship, the BCS did generate enough excitement down the stretch to cause college football home attendance to soar to an all-time high of more than 46 million fans.
That BCS excitement coupled with the rule allowed Divisions I-A and I-AA institutions to play as many as 12 regular-season games for the second consecutive year. That helped home attendance jump more than 1.5 million fans in 2003 to follow on the heels of a four million increase in 2002.
The 617 NCAA teams totaled 46,144,539 fans for all four divisions, surpassing the former mark of 44,556,215, set in 2002. The record total was an increase of 1,588,324, and, as mentioned, followed only 2002, the all-time record increase at 4,055,392. The per-game average for all games and all divisions, was 13,568, which was the best overall mark since 1984 (13,852).
The additional games seem to have a direct impact on home attendance. In Divisions I-A and I-AA, member institutions are allowed to play 12 contests during those years in which there are 14 Saturdays from the first permissible playing date through the last playing date in November. The 2003 season will be the last one allowing 12 games until 2008 (followed by 2013, 2014 and 2019).
In 2001, without the extra games, Division I-A schools averaged just 5.75 home games. In 2002, with the extra games, schools averaged 6.27 home games, leading to an increase in attendance totals. In 2003, the built-in boost continued as I-A schools played an average of 6.09 home games.
The figures for the 2003 attendance compilation were submitted by both the sports information departments and ticket offices and are not considered official audited attendance. Official audited attendance for 2003 will be requested later by other NCAA departments. For the second year in a row, postseason attendance (bowls and championship games) was included in home attendance as long as the games were played on the school's home field. The NCAA began keeping national home football attendance in 1948 (including non-NCAA teams) and began keeping NCAA-only teams in 1978.
As in past years, most of the increases were attributed to Division I-A institutions, which posted an all-time total of 35,085,646, which includes neutral sites and bowl games. Division I-A teams also averaged a record 45,447 fans for all 772 games played this season including 28 bowl games. The bowl games totaled 1,458,757, also the best total in bowl history. In all, Division I-A total attendance was 76 percent of the 2003 total of 46,144,539 fans that attended I-A football games.
Division I-AA also made a great showing by totaling 6,070,116, an increase of 544,866 over last year's total and the second-best total in I-AA history (trailing only 6,193,989 in 1994). Division I-AA's per-game compilation of 8,684 was also a jump of 791 from 2002 and the best per-game since 1999 for the division.
Division II home attendance was up 189,044 from last year with a total of 2,835,856. The home total was the second-most in Division II history, surpassed only by the 2,871,683 in 1978 and its 3,608 per-game total was the best in the division since 1994.
Division III joined the party with an increase of 153,258 fans from last year with a 2,152,921 total, third-best in division history.
Wolverines Make It Six in a Row
Michigan won its sixth consecutive home attendance title averaging 110,918 for its 7 home games, the third-best average in college football history. The 2003 per-game norm was surpassed only by the Wolverine's own all-time mark of 111,175 in 1999 and the Michigan average of 110,965 in 1998.
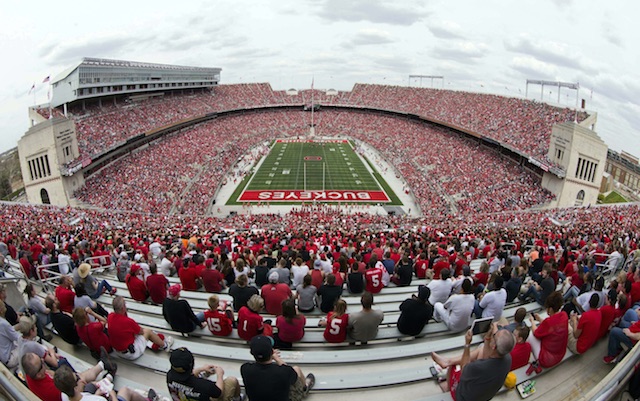
In total attendance, Ohio State was the clear leader with 838,963 in 8 home games (104,870 in per-game) outdistancing Michigan's 776,429 in 7 home games; Penn State's 739,403 in 7 home games and Tennessee's 735,269 in 7 home games.
Trailing Michigan in per-game were No. 2 Penn State averaging 105,629, No. 3 Tennessee (105,038), No. 4 Ohio State (104,870) and Georgia (92,058) rounding out the top five. It was the third time in college football history that four teams averaged more than 100,000 in home attendance (2001 and 2002).
National co-champion LSU was sixth averaging 90,974 at Tiger Stadium in Baton Rouge while Florida was seventh at 90,177, followed by No. 8 Auburn (85,203), No. 9 Texas (83,339) and No. 10 Oklahoma (83,202).
The top 10 team rankings were dominated by the Southeastern Conference with five teams, the Big Ten Conference with three teams and the Big 12 Conference with two teams. With five of the top 10 teams in home attendance, the SEC set national highs in both total attendance (6,146,890) and per-game (74,059). The SEC is the first conference to go over six million in total attendance just as it did with five million in 1997. In per-game average, the SEC has also turned in five of the six season averages over 70,000 per game, all five consecutive since 1999.
The SEC captured its sixth straight I-A league attendance title (with all-time high 74,059) to nip the Big Ten Conference (70,198). The Big 12 Conference was third (56,362) followed by the Atlantic Coast Conference (51,938) and the Pacific-10 Conference (51,608). Six of the I-A conferences set total attendance marks in 2003 and four leagues set records in per-game attendance.
Yale Takes I-AA Attendance Crown
The Yale Bulldogs made the biggest improvement of any divisional team in 2003 to capture the I-AA attendance title for the second time in school history (also in 1985). The Bulldogs improved by more than 14,000 fans per game enroute to a 6-4 season record and averaged 23,578 to edge Montana, which averaged 23,352 per game.
Florida A&M played only three home contests but averaged 21,323 per outing for third on the list followed by No. 4 Southern University (19,732) and I-AA national champion Delaware (18,895) in fifth place.
Twelve-time team champion Jackson State was sixth at 18,196 followed by No. 7 The Citadel (16,759), No. 8 North Carolina A&T (16,066), No. 9 Youngstown State (16,004) and No. 10 McNeese State (15,986).
The Southwestern Athletic Conference added to its domination in attendance by claiming its 26th consecutive league title by averaging 12,083 per-game. The SWAC is the only conference ever to win a I-AA attendance crown since the NCAA began attendance leaders in 1978.
The Southern Conference was second in the 2003 rankings averaging 10,434 per game w ith No. 3 Ivy League (10,279), No. 4 Gateway Conference (10,195) and the Big Sky Conference (10,120) rounding out the top five leagues.
North Dakota State and Stillman lead Divisions II and III
North Dakota State took its fifth overall Division II attendance crown in 2003 after a two-year absence. The Bison averaged 11,567 fans per game to edge No. 2 Miles (11,518) followed by No. 3 two-time defending attendance champion Tuskegee (10,964), No. 4 Grand Valley State (10,446), the reigning two-time Division II national champion, and No. 5 Pittsburg State (9,741).
The Southern Intercollegiate Athletic Conference returned after a one-year hiatus to claim the 2003 Division II league attendance title for the 11th time in the past 12 years. The SIAC averaged 6,521 per game to outdistance last year's leader North Central Intercollegiate Athletic Conference, which finished second at 6,010 followed by the Central Intercollegiate Athletic Association (4,968), the Gulf South Conference (4,746) and the Mid-American Intercollegiate Athletic Association (4,733).
In Division III, Stillman took its first attendance title averaging 7,250 per game to pass defending champion St. John's (Minnesota) at 6,496. Others in the top five were Mount Union (4,936), Emory & Henry (4,767 and Wartburg (4,270).
The Ohio Athletic Conference made it two straight league attendance crowns by averaging 3,093 per game to edge the Minnesota Intercollegiate Conference (2,925). Rounding out the top five were the Old Dominion Conference (2,798), which won 13 straight titles from 1989-2001, the New England Small College Conference (2,360) and the Michigan Intercollegiate Athletic Association (2,312).
Jan. 24, 2004
By Richard M. Campbell
NCAA Assistant Director of Statistics
Attendance Rankings by Division: I-A | I-AA | II | III
Rankings by Conference
It was no secret that many football fans were disappointed with the Bowl Championship Series (BCS) results, which produced Division I-A national co-champions, LSU and Southern California. In spite of the split national championship, the BCS did generate enough excitement down the stretch to cause college football home attendance to soar to an all-time high of more than 46 million fans.
That BCS excitement coupled with the rule allowed Divisions I-A and I-AA institutions to play as many as 12 regular-season games for the second consecutive year. That helped home attendance jump more than 1.5 million fans in 2003 to follow on the heels of a four million increase in 2002.
The 617 NCAA teams totaled 46,144,539 fans for all four divisions, surpassing the former mark of 44,556,215, set in 2002. The record total was an increase of 1,588,324, and, as mentioned, followed only 2002, the all-time record increase at 4,055,392. The per-game average for all games and all divisions, was 13,568, which was the best overall mark since 1984 (13,852).
The additional games seem to have a direct impact on home attendance. In Divisions I-A and I-AA, member institutions are allowed to play 12 contests during those years in which there are 14 Saturdays from the first permissible playing date through the last playing date in November. The 2003 season will be the last one allowing 12 games until 2008 (followed by 2013, 2014 and 2019).
In 2001, without the extra games, Division I-A schools averaged just 5.75 home games. In 2002, with the extra games, schools averaged 6.27 home games, leading to an increase in attendance totals. In 2003, the built-in boost continued as I-A schools played an average of 6.09 home games.
The figures for the 2003 attendance compilation were submitted by both the sports information departments and ticket offices and are not considered official audited attendance. Official audited attendance for 2003 will be requested later by other NCAA departments. For the second year in a row, postseason attendance (bowls and championship games) was included in home attendance as long as the games were played on the school's home field. The NCAA began keeping national home football attendance in 1948 (including non-NCAA teams) and began keeping NCAA-only teams in 1978.
As in past years, most of the increases were attributed to Division I-A institutions, which posted an all-time total of 35,085,646, which includes neutral sites and bowl games. Division I-A teams also averaged a record 45,447 fans for all 772 games played this season including 28 bowl games. The bowl games totaled 1,458,757, also the best total in bowl history. In all, Division I-A total attendance was 76 percent of the 2003 total of 46,144,539 fans that attended I-A football games.
Division I-AA also made a great showing by totaling 6,070,116, an increase of 544,866 over last year's total and the second-best total in I-AA history (trailing only 6,193,989 in 1994). Division I-AA's per-game compilation of 8,684 was also a jump of 791 from 2002 and the best per-game since 1999 for the division.
Division II home attendance was up 189,044 from last year with a total of 2,835,856. The home total was the second-most in Division II history, surpassed only by the 2,871,683 in 1978 and its 3,608 per-game total was the best in the division since 1994.
Division III joined the party with an increase of 153,258 fans from last year with a 2,152,921 total, third-best in division history.
Wolverines Make It Six in a Row
Michigan won its sixth consecutive home attendance title averaging 110,918 for its 7 home games, the third-best average in college football history. The 2003 per-game norm was surpassed only by the Wolverine's own all-time mark of 111,175 in 1999 and the Michigan average of 110,965 in 1998.
In total attendance, Ohio State was the clear leader with 838,963 in 8 home games (104,870 in per-game) outdistancing Michigan's 776,429 in 7 home games; Penn State's 739,403 in 7 home games and Tennessee's 735,269 in 7 home games.
Trailing Michigan in per-game were No. 2 Penn State averaging 105,629, No. 3 Tennessee (105,038), No. 4 Ohio State (104,870) and Georgia (92,058) rounding out the top five. It was the third time in college football history that four teams averaged more than 100,000 in home attendance (2001 and 2002).
National co-champion LSU was sixth averaging 90,974 at Tiger Stadium in Baton Rouge while Florida was seventh at 90,177, followed by No. 8 Auburn (85,203), No. 9 Texas (83,339) and No. 10 Oklahoma (83,202).
The top 10 team rankings were dominated by the Southeastern Conference with five teams, the Big Ten Conference with three teams and the Big 12 Conference with two teams. With five of the top 10 teams in home attendance, the SEC set national highs in both total attendance (6,146,890) and per-game (74,059). The SEC is the first conference to go over six million in total attendance just as it did with five million in 1997. In per-game average, the SEC has also turned in five of the six season averages over 70,000 per game, all five consecutive since 1999.
The SEC captured its sixth straight I-A league attendance title (with all-time high 74,059) to nip the Big Ten Conference (70,198). The Big 12 Conference was third (56,362) followed by the Atlantic Coast Conference (51,938) and the Pacific-10 Conference (51,608). Six of the I-A conferences set total attendance marks in 2003 and four leagues set records in per-game attendance.
Yale Takes I-AA Attendance Crown
The Yale Bulldogs made the biggest improvement of any divisional team in 2003 to capture the I-AA attendance title for the second time in school history (also in 1985). The Bulldogs improved by more than 14,000 fans per game enroute to a 6-4 season record and averaged 23,578 to edge Montana, which averaged 23,352 per game.
Florida A&M played only three home contests but averaged 21,323 per outing for third on the list followed by No. 4 Southern University (19,732) and I-AA national champion Delaware (18,895) in fifth place.
Twelve-time team champion Jackson State was sixth at 18,196 followed by No. 7 The Citadel (16,759), No. 8 North Carolina A&T (16,066), No. 9 Youngstown State (16,004) and No. 10 McNeese State (15,986).
The Southwestern Athletic Conference added to its domination in attendance by claiming its 26th consecutive league title by averaging 12,083 per-game. The SWAC is the only conference ever to win a I-AA attendance crown since the NCAA began attendance leaders in 1978.
The Southern Conference was second in the 2003 rankings averaging 10,434 per game w ith No. 3 Ivy League (10,279), No. 4 Gateway Conference (10,195) and the Big Sky Conference (10,120) rounding out the top five leagues.
North Dakota State and Stillman lead Divisions II and III
North Dakota State took its fifth overall Division II attendance crown in 2003 after a two-year absence. The Bison averaged 11,567 fans per game to edge No. 2 Miles (11,518) followed by No. 3 two-time defending attendance champion Tuskegee (10,964), No. 4 Grand Valley State (10,446), the reigning two-time Division II national champion, and No. 5 Pittsburg State (9,741).
The Southern Intercollegiate Athletic Conference returned after a one-year hiatus to claim the 2003 Division II league attendance title for the 11th time in the past 12 years. The SIAC averaged 6,521 per game to outdistance last year's leader North Central Intercollegiate Athletic Conference, which finished second at 6,010 followed by the Central Intercollegiate Athletic Association (4,968), the Gulf South Conference (4,746) and the Mid-American Intercollegiate Athletic Association (4,733).
In Division III, Stillman took its first attendance title averaging 7,250 per game to pass defending champion St. John's (Minnesota) at 6,496. Others in the top five were Mount Union (4,936), Emory & Henry (4,767 and Wartburg (4,270).
The Ohio Athletic Conference made it two straight league attendance crowns by averaging 3,093 per game to edge the Minnesota Intercollegiate Conference (2,925). Rounding out the top five were the Old Dominion Conference (2,798), which won 13 straight titles from 1989-2001, the New England Small College Conference (2,360) and the Michigan Intercollegiate Athletic Association (2,312).
 )
)